
Originally published at: 5.0 and 6.0 Differences | Indeni
This guide is intended to help Indeni end-users understand the basic fundamentals of the alerting mechanism, and differences, in how they operate in versions 5.5 and 6.0. The examples used assumes that Alert Thresholds have been set. Please download the full 5.0 User Guide for more detailed information on 5.5 Alert management.
Differences in Alerting Mechanisms
5.5 and 6.0 have essentially the same fundamental processes when reporting issues, the main difference is how they are handled and viewed on the User Interface.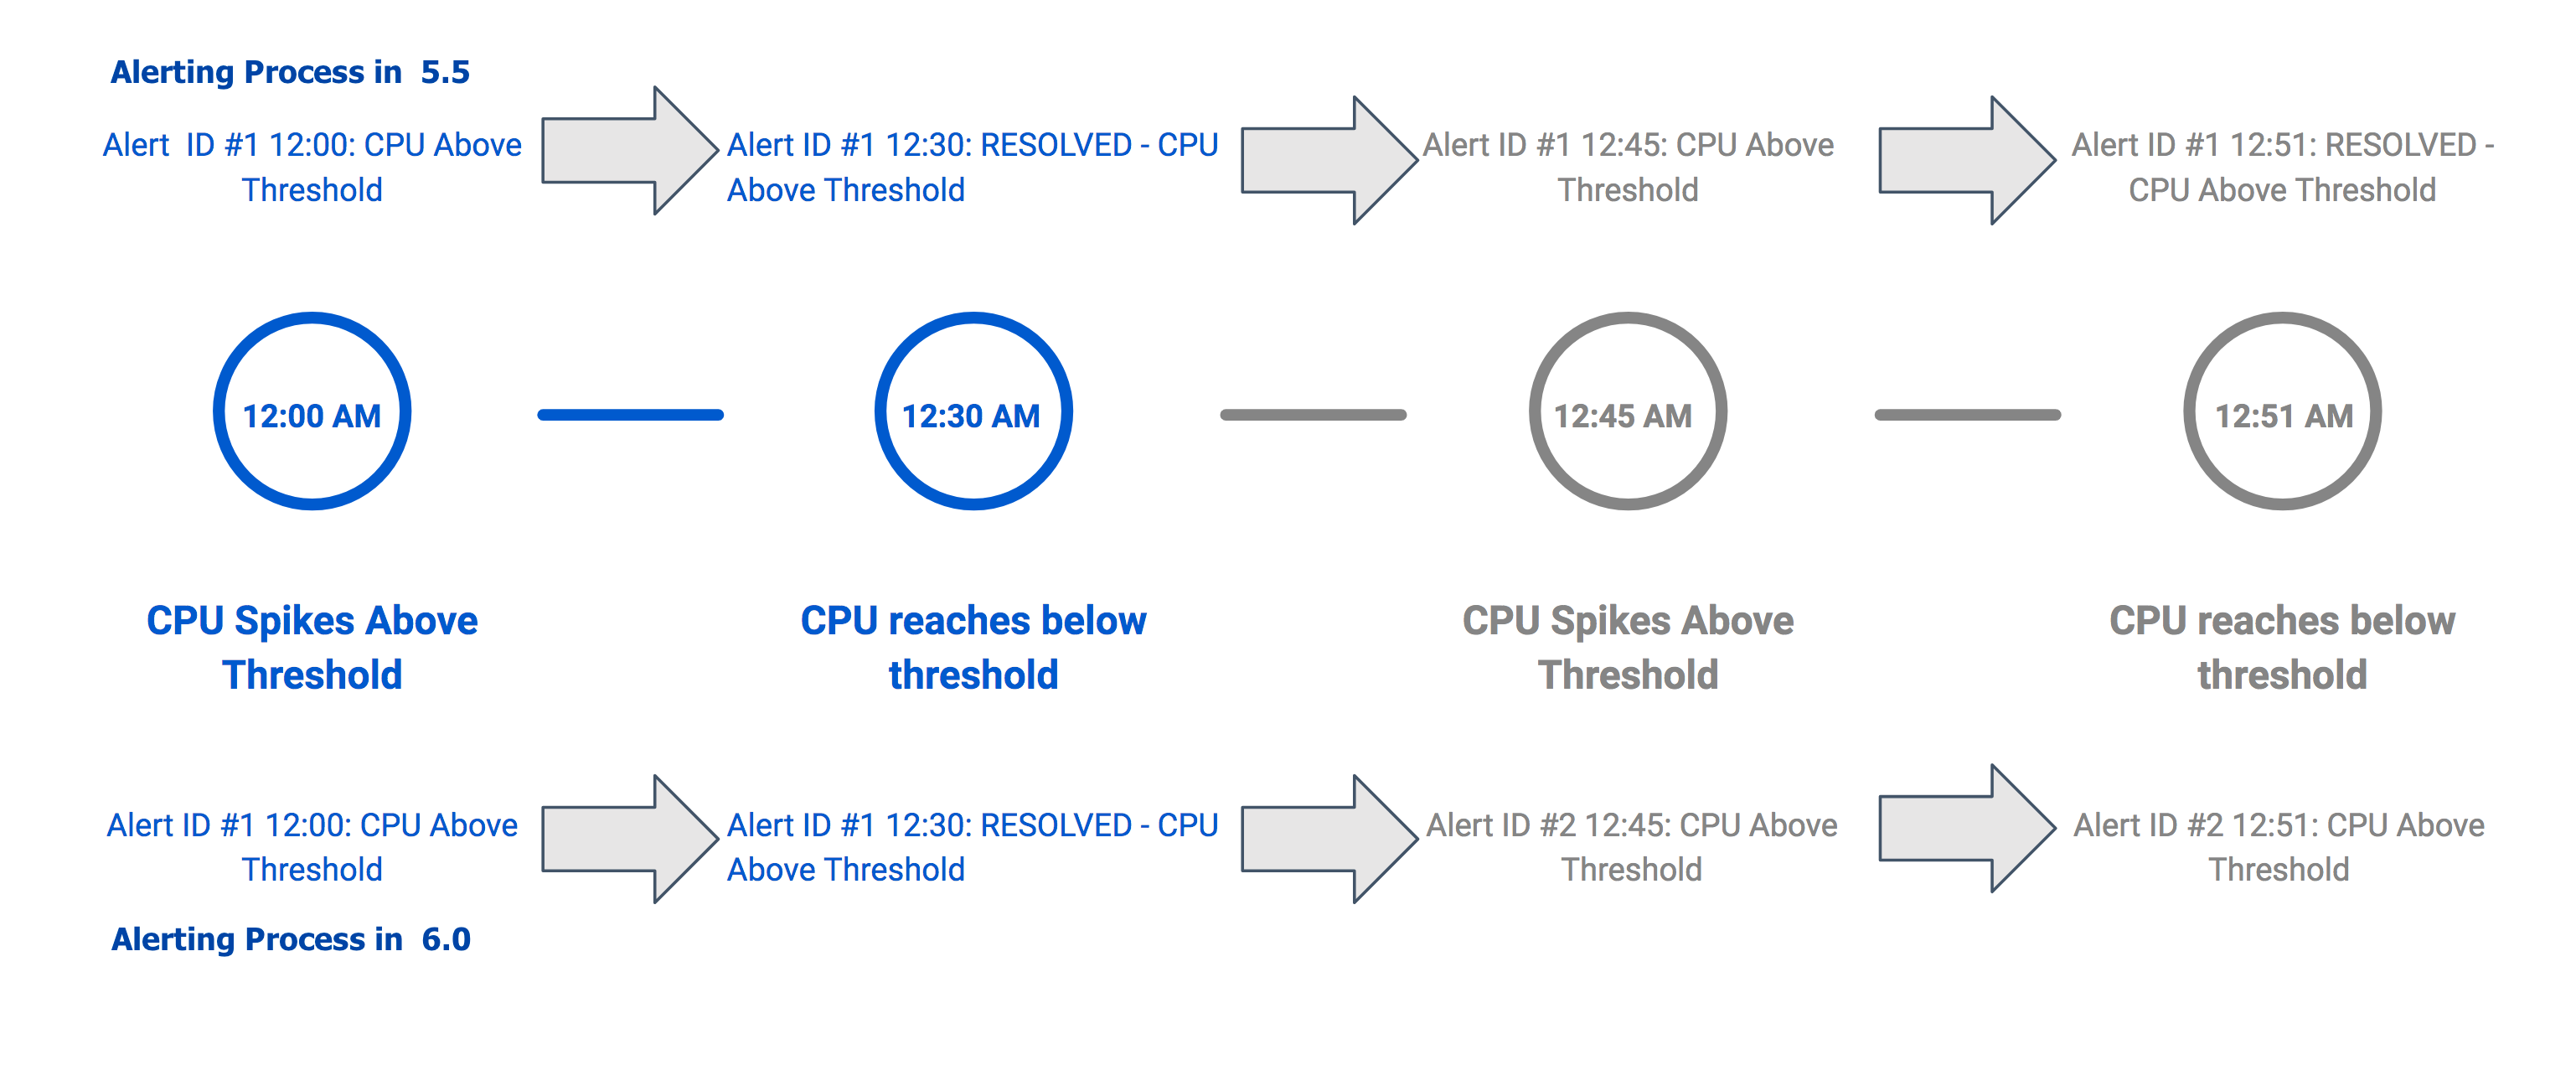
As you can see the actual processes of handling a flapping issue is very similar between version 5.5 and 6.0. The biggest difference is that alerts in 5.5 are re-used until they are manually acknowledged. Let’s a take a closer look at the flow of acknowledging resolved and unresolved alerts in 5.5:
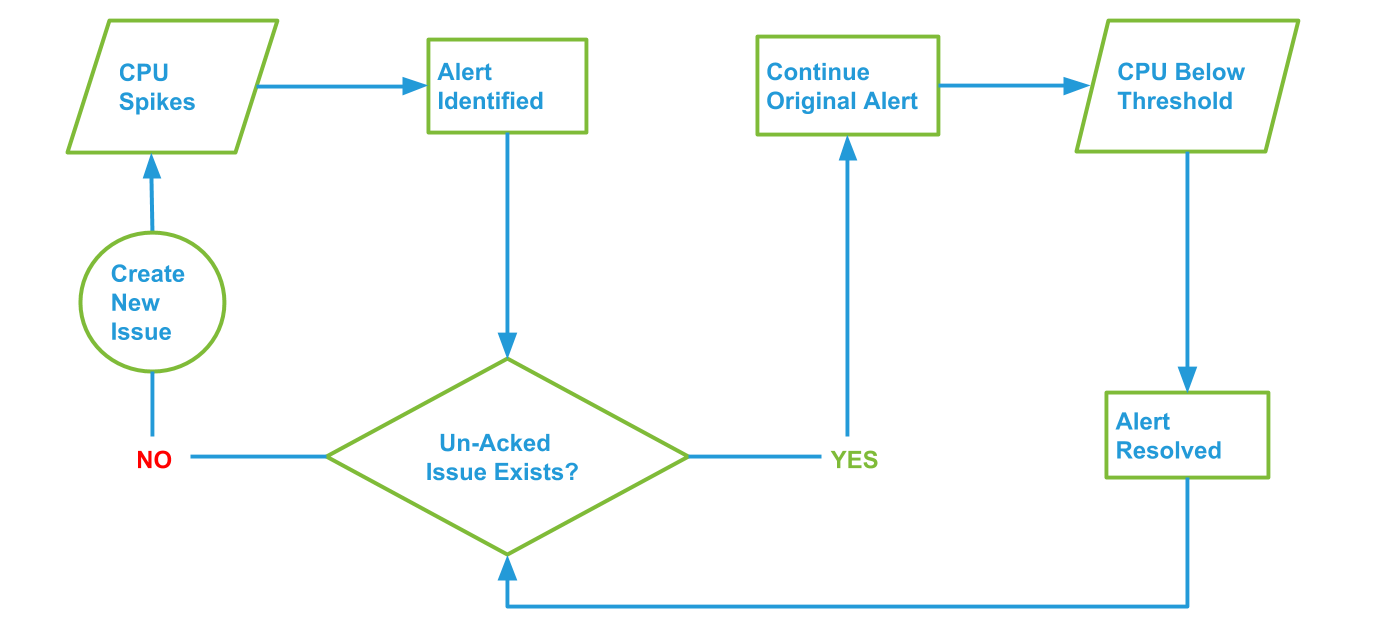
As you can see from this detailed flowchart, in 5.5, you need to Acknowledge an alert regardless if the issue is resolved or not. Here are some other important points to understand about Acknowledging Alerts:
- All Alerts will stay on the Alert Tab in perpetuity until Acknowledged, regardless if the issue is resolved, unresolved, or flapping.
- Acknowledging alerts is not resolving the alert. It is simply setting it aside in the Acknowledged tab, allowing the end-user to see a new alert as the relevant issue comes up again.
- Acknowledging alerts is not ignoring the alert. To avoid alerting on a known issue you must use the ‘ignore this’ option within the Alert Details, or Stop Alerting for a device.
- Acknowledging Alerts will not hide an issue if it is flapping. If an issue continues to reoccur, it creates a new alert to ensure the end-user is made aware of the issue.
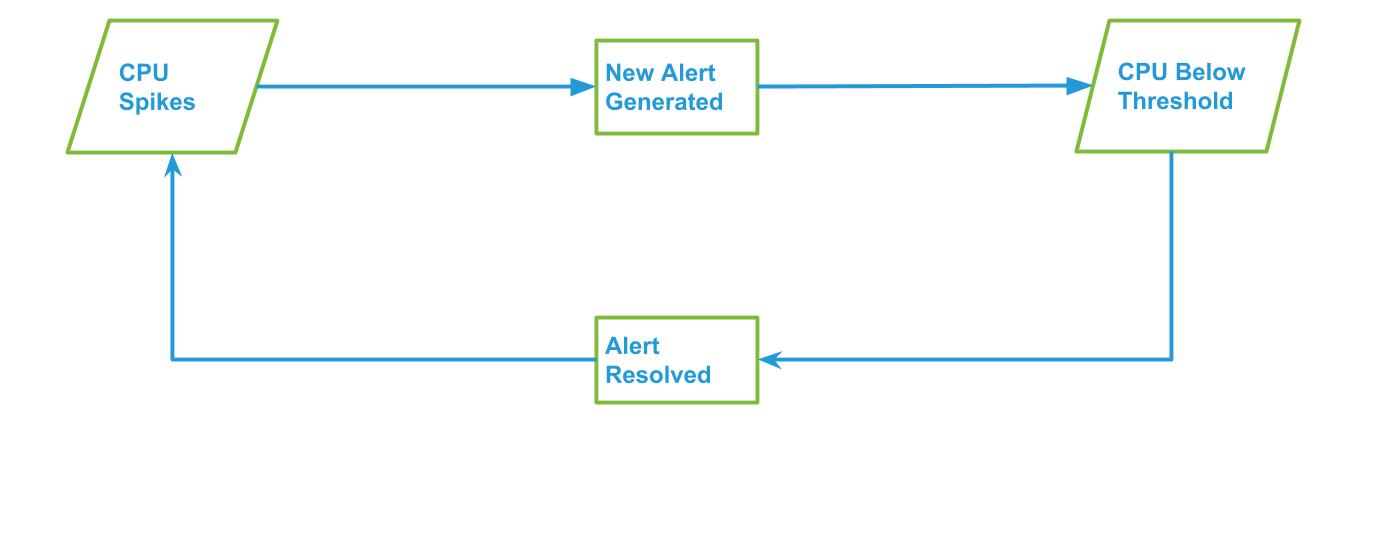
As you can see from this flowchart, removing the Acknowledged button allows for a more seamless, and autonomous, end-user experience. In version 6.0, resolved and unresolved issues will still be present in their perspective homes, until they are Archived. Once an issue is Archived, they will be present in the Archive Tab.
You can choose to Unarchive an issue at anytime. Please visit 3.2-Current Tab, for more detailed information on how 6.0 Issue Generation works.
Difference in Notification Process
Notifications, on both versions, can be routed via SMTP, SNMP and SYSLOG, and is only provided one time when creating a new issue. The major difference between the versions is that Indeni 5.5 will initiate a notification when an issue condition is identified, and will not provide additional notification during alert recycling. In Indeni 6.0 there is no recycling, so the next time that the issue occurs it will generate a notification.While you can download the full 5.5 User Guide as a reference, this section will allow 5.5 end-users can quickly understand how to configure Alerts and get a basic understanding how to use the syste.
Brief 5.5 Alerting Configuration and Information
The Alerts tab displays all alerts noted by the system under the Current Alerts pane. Even when the issue has been successfully resolved, the alert will remain on the display until the user acknowledges and archives the resolved alert, or chooses to show only unresolved alerts. Resolved alerts are marked as “RESOLVED:”.Monitored Devices
Indeni displays all devices by name under Monitored Devices . The View button in the left panel allows users to display objects by group, device type, cluster, or management hierarchy.The left panel of the Monitoring tab displays all devices currently being analyzed by Indeni. Use the View button on the left to toggle between displaying devices by cluster, type, or management hierarchy. Use the orange arrow to edit or filter alerts for individual devices or groups of devices. The Search field allows users to search for devices by any portion of a device name.
Current Alerts
The checkboxes in the left column of this portion of the screen allow users to manage multiple alerts.- Use the topmost checkbox (in the header row) to check or uncheck all boxes at once or to select those for the current page only.
- Use the small, black down arrow beside the box to adjust selections as shown below.
- Click “None” or click the box again to uncheck all selections.
The Search box in the Current Alerts pane supports searching for alerts associated with certain devices using the device name or IP address, searching for an alert ID, or searching for text within alert headlines and descriptions.
- To display alerts for a particular device, type the device name in the Search field. (You can also click on the orange circle to the right of the device name in the Monitored Devices section to display alerts for that device only.)
- To display a particular kind of alert, type the desired parameter in the Search field.
- To search for text, type a text string. For example, typing “R60SMC” in the Search field will display alerts for all R60SMC members. Clearing the field restores the entire list.
Filtering Alerts
To filter alerts, use the orange arrow next to its name in the Monitored Devices display and choose Filter Current Alerts from the pop‐up menu.Use the checkbox to the left of the ID field to check or uncheck all filtered alerts at once.
Columns and Functionality
To adjust the width of individual columns on the screen, select the Columns option on the View flyout: Use the checkboxes to select which columns to display. Alternatively, right‐click on any column header to access this menu.Severity
This column displays a colored flag for each alert. Colors range from red to blue to distinguish critical warnings from less severe alerts. This allows users to find and resolve alerts most likely to cause imminent downtime and to visually assess the type of alert and remedial action required.The Monitored Devices list also displays the current state of the device itself using the icons shown here. If a device has other alerts, it will indicate the number and type using text colors corresponding to the flags (blue for Info, etc.)
By default, Indeni displays alerts as they occur. To quickly sort by severity, click the View button above the Device column. Click on or off any of the alert categories in the flyout box shown on the next page (only one option can be selected at a time) and Indeni will display only that information. For example, if you do not wish to see resolved alerts, click Unresolved Only . Indeni will only display alerts the system has not yet resolved or could not automatically resolve.
Indeni also provides a fast and convenient listing of each device’s individual alerts under its name in the list of Monitored Devices on the left. This provides at‐a‐glance status for each device. Critical status only appears if the device is truly unresponsive or Indeni is having trouble analyzing it; otherwise the Okay symbol will be shown even if there are alerts for this device. The user can see that the device, while still functional, has errors and can investigate and correct them as required.
ID: Indeni assigns a unique number to each alert as it occurs. By default, alerts display in descending order of severity and by date modified.
Device: This column displays the device name assigned to each device for which an alert has been flagged.
Headline: This column displays the actual alert information: a brief description of the condition Indeni has observed as well as its status.
In this column each alert in the list displays in the “collapsed“ or at‐a‐glance mode, showing just the summary headline for the alert.
Last Update: This column allows users to further refine the displayed list of alerts by date range. Click the Filter icon in the column header. Click inside each blank field box to display a calendar. Choose the date range for the alerts you want to display and then click Apply.
To filter within a particular day, change the hour settings after the date in both the From and To fields to display alerts within a specified time range.
Click Clear to clear the previous criteria. This will restore the entire list of alerts. To quickly sort alerts in ascending or descending order by date, click on the column name. A yellow arrow will appear. Click on it to sort the alerts.
Expanding an Alert
To expand an alert to show its details, click on any headline. In the expanded detail, information is categorized in several ways:Description: A general overview and explanation of the problem.
Custom Notes: Gives users the option to add their own notes to a specific signature or to a specific group.
Manual Remediation Steps: Indeni’s recommendation for how to manually correct the problem.
Notes and History: A summary of when the alert has been created, resolved, or remains unresolved, along with any notes which were added to the alert by using the blue “Append note” link.
Indeni constantly updates unresolved alerts. You can freeze the display to stop the system from updating content for the current alerts by toggling the Freeze button. Click the button again to resume updates.
Resolving Alerts
Indeni can flag certain errors and offer suggestions on how to resolve issues manually. Each Headline message, when expanded, tells the user if an error can be resolved or not, and what the recommended manual action should be. Click on the alert to expand it and read the details provided by Indeni for resolution. If hyperlinks are included, clicking on those will provide more information on the alert and the process for remediating the issue.Using the Resolve Button
Indeni provides a Resolve button above the Headline column to assist users in resolving alerts. It is enabled when at least one visible alert is checked. Clicking on the Resolve button gives the user several options, from acknowledging and archiving an alert to manually changing configuration settings for the device in question. Note that the Resolve button will not activate unless an alert is checked, not just highlighted.Clicking on the Resolve button produces a flyout menu with the options shown on the next page.
PLEASE NOTE: Functions on the Resolve menu vary by the type of alert, as well as whether or not multiple alerts were selected or not. For instance, “Stop Alerting for this Device” may not be an option for all alerts.
Acknowledge Selected Alerts
Selecting this option archives the alert in the Alert Archive and removes it from the list. Resolved alerts which have been reviewed by an administrator should be acknowledged in order to move them to the history. To do so, click on the Resolve button and then select Acknowledge Selected Alerts .Stop Alerting for this Device
Selecting this option will prevent Indeni from flagging this particular error on this device. It does not block flagging of other errors for this device.Check Alert Configuration for this Device
This option allows users to quickly review and edit alert settings for a particular device.Review Device Configuration
This option quickly takes the user to the configuration screen for this device to check and/or change settings that might be causing the error.Advanced
This option provides several choices, from configuring default parameters to halting alerts on selected devices. It allows the user to either stop alerting for a particular error on one device only, or to prevent Indeni from flagging this error on all analyzed objects.Resolving Multiple Alerts
- Use the checkboxes in the far left column of the Monitoring tab to archive multiple Resolved alerts at once.
- Check the box for each alert you want to archive.
- Click the Resolve button and select Acknowledge Selected Alerts to archive these alerts.
Annotating Alerts
Each individual alert issued by Indeni can be manually annotated by users, allowing them to communicate among themselves regarding specific alerts, as well as noting down observations and actions to be taken. Indeni automatically populates the notes with major status changes of the alert such as when it was created, when it was deemed resolved, and when it was acknowledged.Appended notes pertain solely to the alert they were added to, and not to future or other instances of the same issue in other devices. If you would like to add notes to all future alerts issued for a certain issue, add Custom Notes to the configuration of the alert. To append a note to an alert:
- Click on the alert to expand it.
- Scroll to the bottom of the expanded details to Notes and History.
- Click Append note. Indeni will display a dialog box.
- Type your note text in the box and click Append to save it permanently to the alert’s details.
Temporarily Disabling Analysis
If alerting is to be suspended for a period of time on a particular device, its configuration can be set so that Indeni will not analyze it:- At the Monitoring tab, choose the device from the list of Monitored Devices on the left.
- Click the symbol to access the Edit Device Configuration menu.
- Choose Stop or Suspend Monitoring Device from the flyout menu. The dialog box will appear as shown.
Users can choose to stop analysis permanently, or suspend it for a specified period of time. To resume analysis that has been disabled.
- Use the Settings tab to adjust the device configuration in the Monitoring Method field. You may also use this field to set the device to Do Not Analyze.
- Save your changes. Indeni will no longer analyze this device or display alerts for it.