
Here at Indeni we take IT management to the next level. We believe that many problems from the IT world can be solved using statistics. We work together with IT experts from around the world to identify opportunities to leverage statistics. By working together we get pretty cool results.
One of the first issues we decided to tackle was DNS servers. A DNS server is a remote computer server that contains a database with IP address and their associated hostnames. In most cases, the DNS server is used to resolve, or translate, those common names to IP addresses as requested. By monitoring the DNS response time in a same level computer network (ether internal or external) we can know if we have a problem: if a server shows a slow response time we can conclude that we have a problem. But how do we decide what is “slow”? We can’t set a simple numeric threshold, like 10ms. In different networks' setups, slow can mean different values. We want to cover as many cases as possible but still we have to be precise. We want the threshold to be as tight as we can find.
Our approach to solving this issue is to build a baseline that would represent the normal values of that specific network, as soon as we exceed those values we create an alert using the Indeni platform.
In the Indeni platform we can build rules for alerting when we have a problem, each rule has building blocks called expressions. After analyzing different scenarios we realized that the same expression (which we call “The Odd One Out Expression”) can be used to distinguish between DNS responses time. Specifically, find out if one DNS server is slower than the others within the same network.
When monitoring a device we collect many different kinds of metrics. Some metrics’ data is from a time series type (basically numeric values measured over time). The DNS response time data is a metric from a time series type. We built a rule that utilizes the “Odd One Out Expression” so we can compare the DNS response time - time series to other DNSs’ response time, in order to know which DNS servers respond slowly.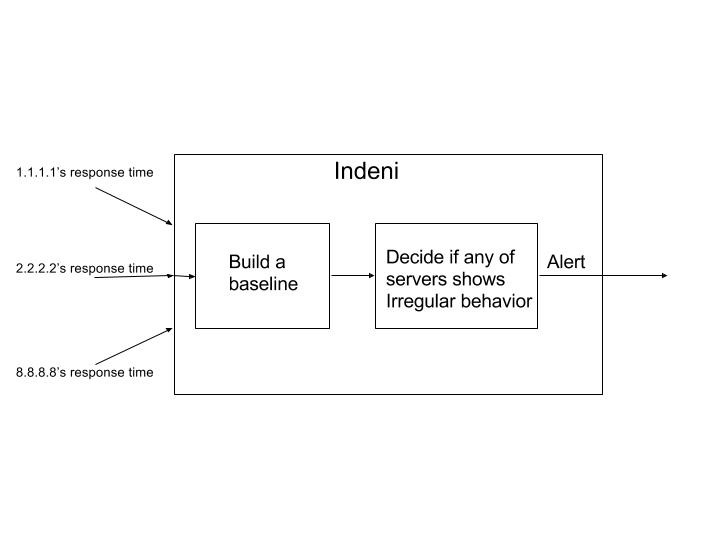
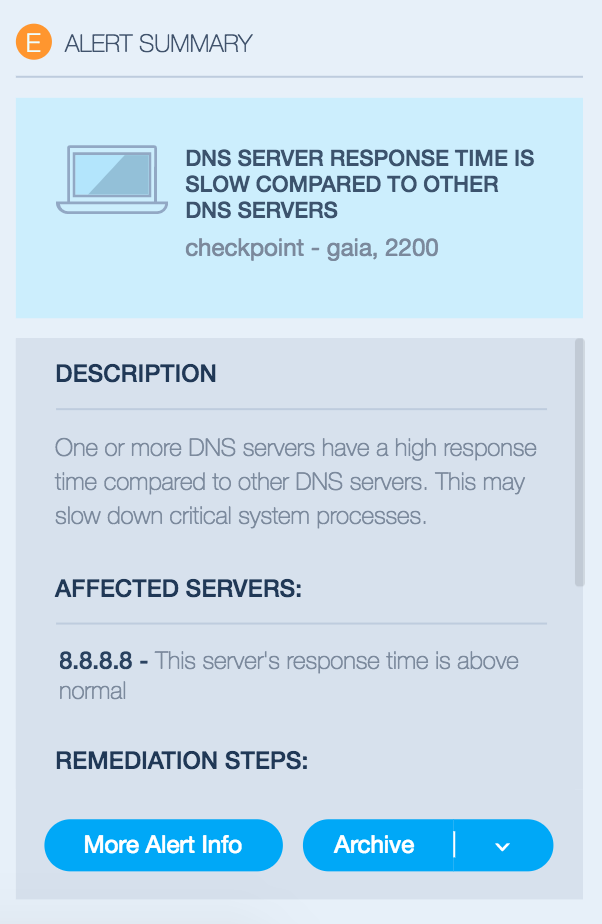
The “Odd One Out Expression” is used in the “Odd DNS Response Time Rule”. The rule takes as an input a group of time series, from different DNS servers, measured from a single device monitored by Indeni. As you can see in the diagram above, we use the input time series to build a baseline. The baseline is defined as “normality” - how the system should behave in normal conditions. But when one of the DNS servers’ response time starts diverting from the baseline, a behavior that doesn't match with the other servers, the “Odd One Out Expression” will flag the time series and an alert will be issued for the relevant DNS server.
How does the Rule decide if it should alert?
Most of algorithms for detecting a problem work the same. They build a baseline and then they decide that there is a problem if:
The return values are more than the baseline + X.
The return value are more than Y times the baseline.
(X could be values like 20ms, 30 ms
Y could be value like 20%, 30%)
Both ways are not so perfect since, when using method A we can create false positives when the values are low and X is also low:
Values: 2ms, 3ms, 4ms
X = 4ms
Threshold (median of values + X) = 7ms
When a value like 8ms comes in it will trigger an alert, but to be fair, a 8ms DNS response time is not that bad the value is still pretty low and not alert worthy.
On the other hand, method B is not good enough on its own since setting Y to be a percentage of the threshold values could lead to different outcomes when the threshold is too small or too large. Our approach is using both methods, only when both A and B occur, issue an alert.
Let’s analyze the following example:
We have three DNS servers with the following addresses. In this example all of the DNS servers are in the same level network and we require them to have similar response times:
Server name |
IP address |
Server A |
1.1.1.1 |
Server B |
2.2.2.2 |
Server C |
8.8.8.8 |
We can see that each DNS server has response time values that represent a time series.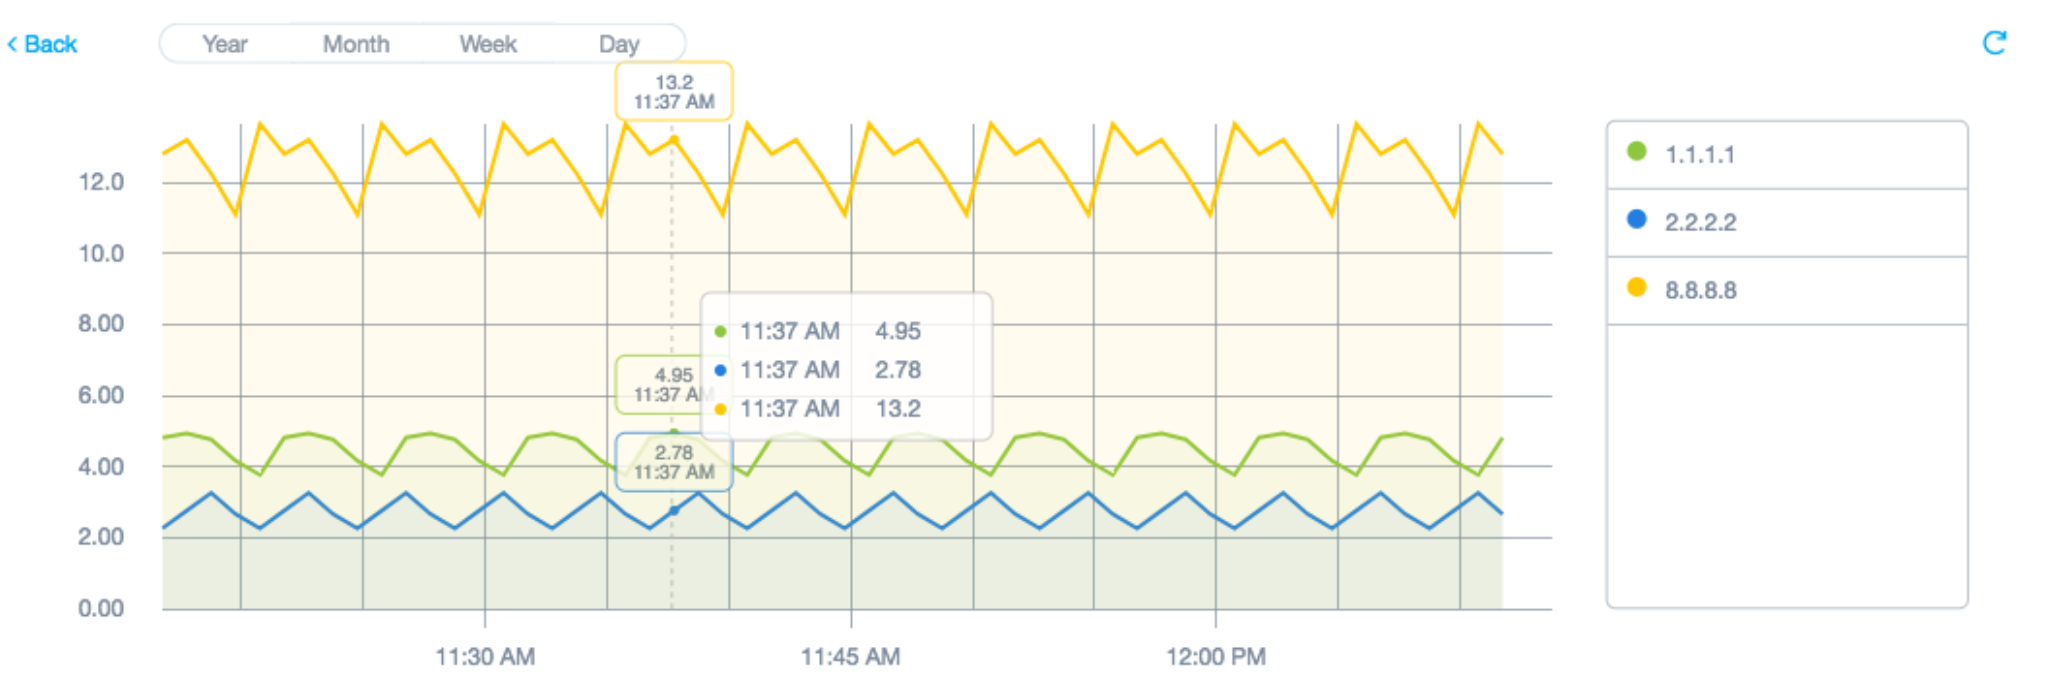
The “Odd DNS Response Time Rule” that uses “Odd One Out Expression” selects the server C (IP 8.8.8.8) as odd since the response time is far higher than the other servers we’ve measured against.
The same “Odd One Out Expression” can be used to identify other, similar issues. For example, we will use it to implement a rule where we compare the response times of different servers as measured from a single load balancer. If a server in a group, or pool, is slower than the other servers in the same group, we will alert. Of course, we don’t need to focus on response times, we could compare any set of time series which should normally behave similar to one another.
For those of you interested in the mathematics behind this, please read on:
Let's define the following (TS = timeseries):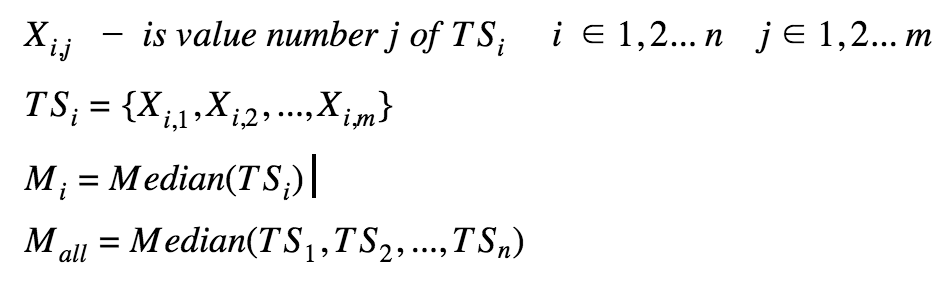
Let’s try it with the numbers from the above example - we have three time series with the following repeating values: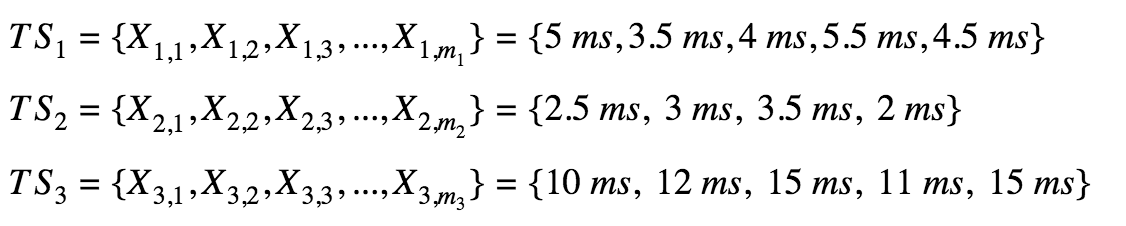
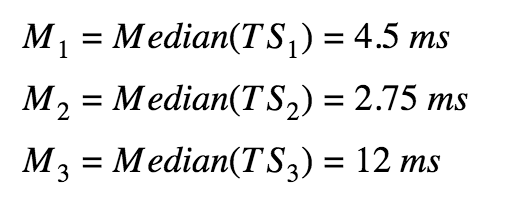
The “Odd One Out Expression” calculates the median for each time series. We chose to work with median as a representor for the time series, and not the mean, for example, since median is not affected from extreme values (very high or very low values, like spikes).
The Expression creates the baseline as the median of all of time series together.

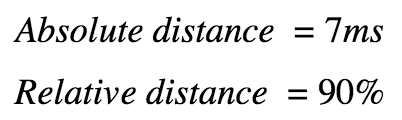
We setup the following two parameters for the “DNS Response Time Rule”:
After it we compare the baseline to each of the time series with following logic:
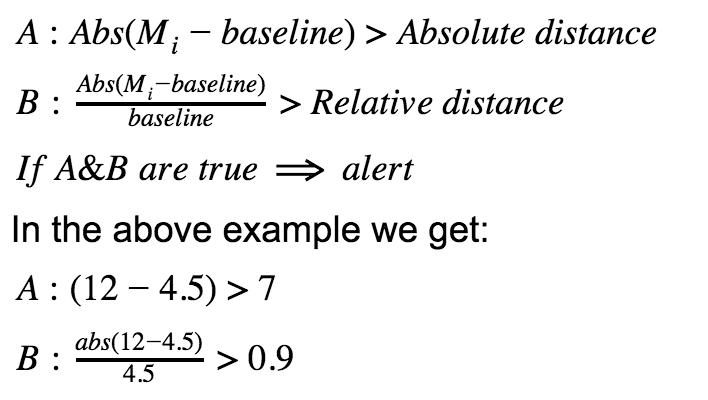
We see that both A and B are true - and we get an alert.